Phylosignal, 500 citations later
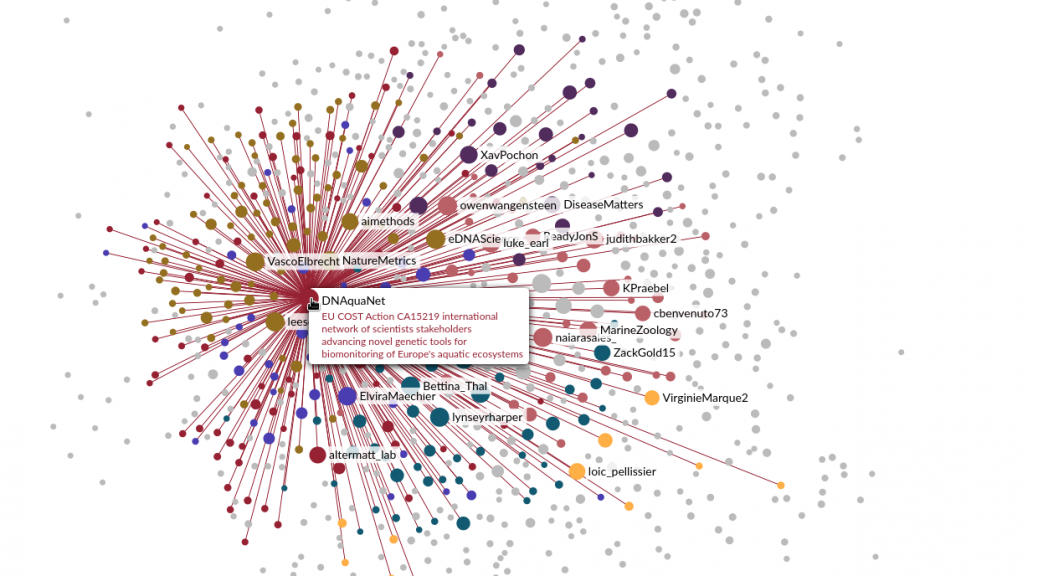
A cartography of the eDNA community on Twitter
I recently published on Twitter the result of some experiments to represent the community of users working on the topic of environmental DNA and metabarcoding. These tweets were quite successful, so I’m writing this quick post to keep a trace of them, and expand a bit the story behind. I had been thinking for some time now about using Twitter data to model this community, probably inspired by projects I saw here and there, and by all the interactions I…
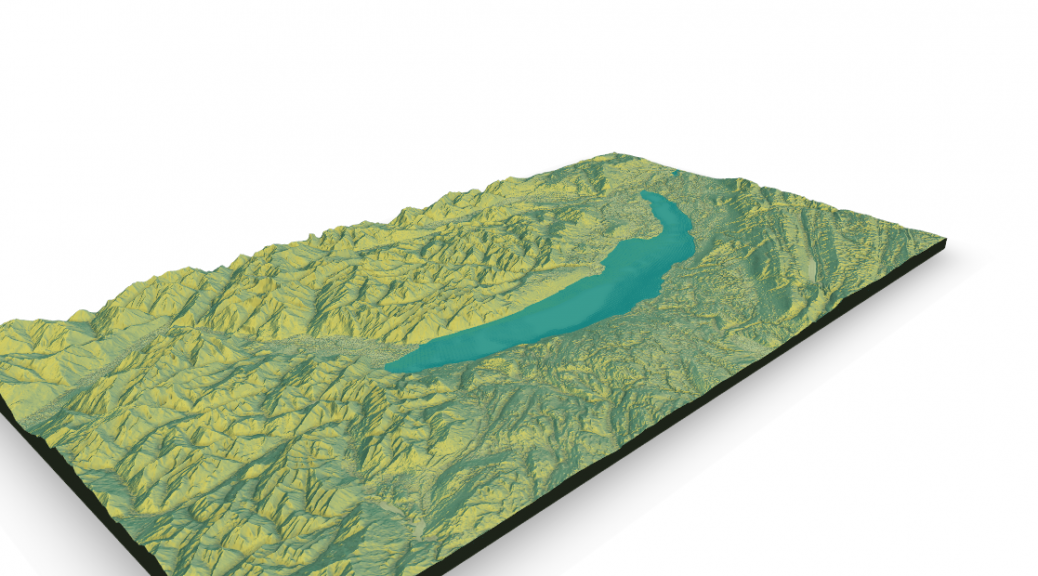
A 3D tour over Lake Geneva with rayshader
If you follow the #rstats news on Twitter, you have most likely seen the impressive 3D maps produced with Tyler Morgan-Wall’s rayshader package. I’ve been wanting to try it for a long time and I finally found the time to do it last week. As a limnologist living on the shores of Lake Geneva, I didn’t hesitate for long about the location of my first map, which, in the excitement of the moment, I immediately published on twitter. Finally I…
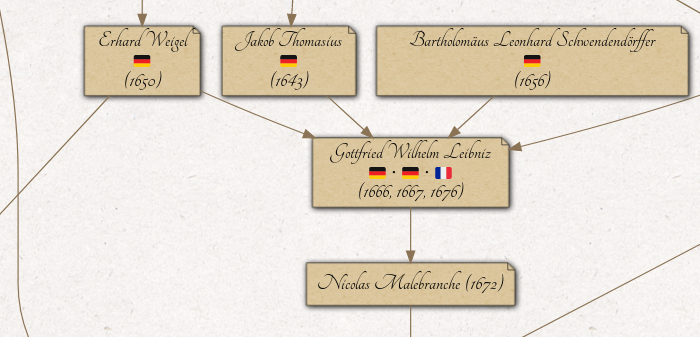
The Mathematics Genealogy Project: Customizing my mathematical family tree
Some time ago, Maëlle Salmon published a very nice post showing how she scraped her mathematical family tree from the Mathematics Genealogy Project. Of course I immediately wanted to produce my own! I am not a mathematician myself, but one of my PhD supervisor has a PhD in mathematics. Which makes me the indirect descendant of a long lineage of famous mathematicians! As Maëlle kindly invited me to share my tree on Twitter, I decided to write this post to…
Introducing editheme: Palettes and graphics matching your RStudio editor
I use RStudio every day at work. And every day my eyes say thank you to the developers for implementing themes support for the editor, and more recently a complete dark skin for the GUI. Dark themes are not only important for your health and the health of the planet. They are also absolutely essential to look cool in the office and make your colleagues believe you’re working on very complicated projects. 😀 However, one little thing could dispel the…
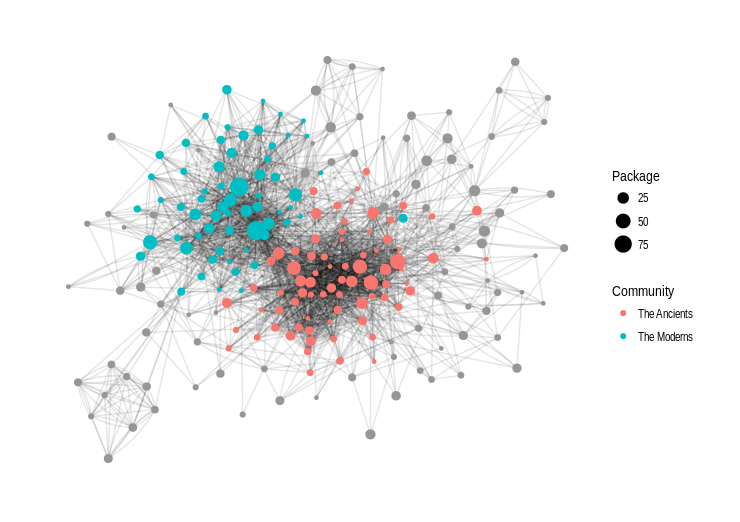
Exploring the CRAN social network
A few months ago, I published a post where I was trying to map the dependencies relationships between R packages. Today I want to do something similar with package contributors. My idea is to reconstruct a social graph where each node would be a person (presumably a developer), and two persons would be connected by an edge if they have collaborated on the same package. Thus I would be able to explore the CRAN social network! This post is also…

Changes in number of authors in ecology journals over time
In a post published on Dynamic Ecology last week, Meghan Duffy presented a graph showing the number of authors of articles published in Ecology for the period 1956-2016. [SPOILER: it increases!]. She also noted that someone probably did something similar for the whole field of ecology but couldn’t find it. Neither could I. I was thinking that it would take a lifetime to collect manually these data (even if I love to spend my time in the dirt of the…
Movies and Series subtitles in R with subtools
Every time I download subtitles for a movie or a series episode, I cannot help thinking about all this text that could be analyzed with text mining methods. As my PhD came to its end in April and I started a postdoc in September, I could use some time of my looong summer break to work on a new R package, subtools which aims to provide a toolbox to read, manipulate and write subtitles files in R. In this post…
Visualizing the R packages galaxy
The idea of this post is to create a kind of map of the R ecosystem showing dependencies relationships between packages. This is actually quite simple to quickly generate a graph object like that, since all the data we need can be obtained with one call to the function available.packages(). There are a few additional steps to clean the data and arrange them, but with the following code everyone can generate a graph of dependencies in less than 5s. First,…